Server Linux menyediakan fitur-fitur yang sederhana tetapi sangat bermanfaat untuk melakukan monitoring terhadap server. Dalam tutorial ini menggunakan Ubuntu, MySQL, PHP-FPM dan Apache2. Eksekusi query MySQL dapat dimonitor dengan MySQL Workbench.
Daftar Isi
Monitoring MySQL, PHP-FPM dan Apache2
watch, ps, cat, grep, wc, free, head, tail, top dan awk dapat digunakan untuk melakukan monitoring penggunaan CPU, thread dan Memory aplikasi PHP-FPM dan Apache2 secara live dalam satu layar. MySQL Workbench dapat digunakan untuk monitoring slow query.
— Monitoring Apache2, PHP FPM dan MySQL

Monitoring MySQL
Gunakan MySQL Workbench
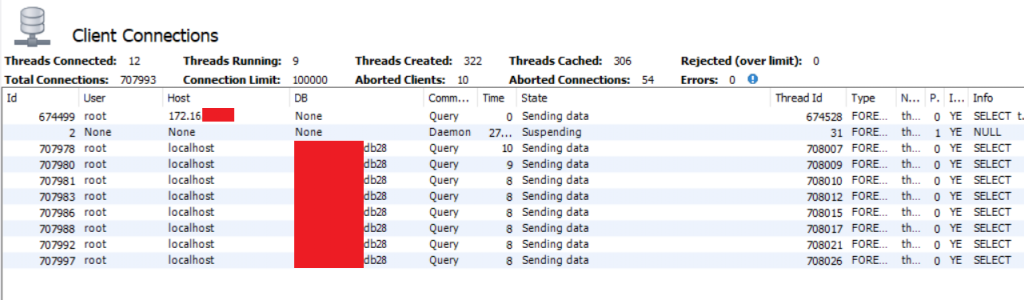
- Buka menu Administration > Client Connections
- Centang pada Hide Sleeping Connections. Hilangkan centang pada Don’t load full thread info
- Klik kanan pada baris yang berjalan lebih dari 5 detik, kemudian pilih Copy Info
Penyelesaian Slow Query
Setting Moodle Untuk Administrator atau Programmer
Monitoring PHP-FPM dan Apache2
Syntax
watch "echo 'MySQL: '; echo -n 'All: '; ps -C mysqld -T --no-headers | wc -l; echo ''; echo 'PHP: '; echo -n 'All: '; ps -C php-fpmx.x -T --no-headers | wc -l; cat /etc/php/x.x/fpm/php-fpm.conf | grep 'process.max = ' | grep -vE '; '; php_=\$(( \$(ps -C php-fpmx.x -T --no-headers | wc -l) * 100 / \$(cat /etc/php/x.x/fpm/php-fpm.conf | grep 'process.max = ' | grep -vE '; ' | awk '{print \$3}') )); php_=\${php_%.*}; for i in \$(seq 1 \$((\$php_ / 4))); do echo -n '='; done; for i in \$(seq 1 \$((25 - (\$php_ / 4)))); do echo -n '_'; done; echo ''; echo -n 'User johndoe: '; ps -C php-fpmx.x -T --no-headers -o user | grep johndoe | wc -l; echo ''; echo 'APACHE: '; ps -C apache2 -T --no-headers | wc -l; cat /etc/apache2/mods-enabled/mpm_event.conf | grep 'MaxRequestWorkers' | grep -vE '#'; apache_=\$(( \$(ps -C apache2 -T --no-headers | wc -l) * 100 / \$(cat /etc/apache2/mods-enabled/mpm_event.conf | grep 'MaxRequestWorkers' | grep -vE '#' | awk '{print \$2}') )); apache_=\${apache_%.*}; for i in \$(seq 1 \$((\$apache_ / 4))); do echo -n '='; done; for i in \$(seq 1 \$((25 - (\$apache_ / 4)))); do echo -n '_'; done; echo ''; echo ''; echo 'Memory (available >0.5G)'; free -hm | awk '{print \$7}' | head -2 | tail -1; mem_=\$(( \$(free -m | awk '{print \$3}' | head -2 | tail -1) * 100 / \$(free -m | awk '{print \$2}' | head -2 | tail -1) )); mem_=\${mem_%.*}; bufcac_=\$(( \$(free -m | awk '{print \$6}' | head -2 | tail -1) * 100 / \$(free -m | awk '{print \$2}' | head -2 | tail -1) )); bufcac_=\${bufcac_%.*}; for i in \$(seq 1 \$((\$mem_ / 4))); do echo -n '='; done; for i in \$(seq 1 \$((\$bufcac_ / 4))); do echo -n 'b'; done; for i in \$(seq 1 \$((25 - (\$mem_ / 4) - (\$bufcac_ / 4)))); do echo -n '_'; done; echo ''; echo 'b: buffer/cache'; echo ''; echo 'Memory (swap =0)'; free -hm | awk '{print \$3}' | head -3 | tail -1; echo''; bmon -p 'eth*' -b -o format:fmt='\$(element:name) \$(attr:rxrate:bytes) \$(attr:txrate:bytes) \$(attr:rxrate:packets) \$(attr:txrate:packets) ' -o format:quitafter=2 | awk '{print \$6\" rx/tx \"\$7/1024\"/\"\$8/1024\" Kbps \"\$9\"/\"\$10\" pps\"}'; echo ''; echo '%CPU (<100.0)'; cpu_=\$(printf %.f \$(top -bn2 | grep '%Cpu' | tail -1 | awk '{print 100-\$8}';)); echo \$cpu_; for i in \$(seq 1 \$((\${cpu_%.*} / 4))); do echo -n '='; done; for i in \$(seq 1 \$((25 - (\${cpu_%.*} / 4)))); do echo -n '_'; done;"Output
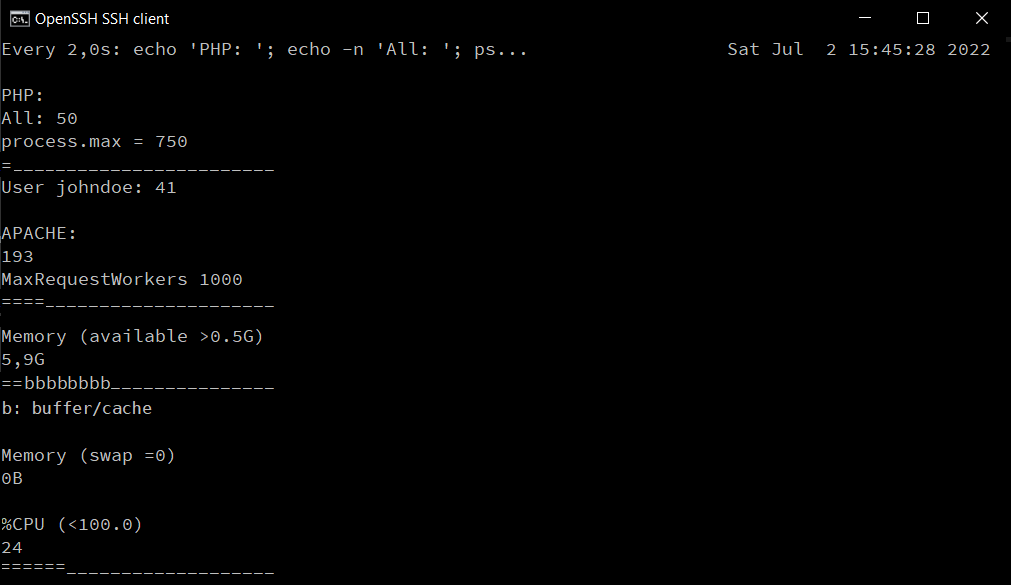
MySQL:
All: 135

PHP:
All: 50
process.max = 750
=------------------------
User johndoe: 41

APACHE:
193
MaxRequestWorkers 1000
====---------------------

Memory (available >0.5G)
5,9G
==bbbbbbbb---------------
b: buffer/cache

Memory (swap =0)
0B

eth0 | v 489.42/46.4539 ^ Kbps | v 387.97/216.98 ^ pps

%CPU (<100.0)
24
======-------------------
Penjelasan
watch <command> digunakan untuk menjalankan perintah secara berulang setiap 2 detik apabila menggunakan setting standar. Oleh karena itu, data monitoring di atas berubah setiap 2 detik.
Perintah watch <command> menjalankan perintah sh -c <command>.
ps <option> digunakan untuk menampilkan proses terkini. -T digunakan untuk menampilkan thread yang berjalan. -C digunakan untuk menampilkan proses tertentu. --no-headers digunakan untuk menampilkan daftar proses tanpa menampikan header.
Untuk menampilkan berapa thread yang berjalan, digunakan opsi -T dan --no-headers.
wc -l digunakan untuk menampilkan jumlah baris.
Di bawah ini adalah contoh dari penerapan ps dan wc. Perintah terakhir adalah perintah yang digunakan untuk menampilkan berapa jumlah thread yang berjalan pada suatu proses.
$ ps -C php-fpm7.0 -T
    PID    SPID TTY          TIME CMD
   9306    9306 ?        00:00:23 php-fpm7.0
   9311    9311 ?        00:00:00 php-fpm7.0
   9312    9312 ?        00:06:22 php-fpm7.0
$ ps -C php-fpm7.0 -T | wc -l
4
$ ps -C php-fpm7.0 -T --no-headers
   9306    9306 ?        00:00:23 php-fpm7.0
   9311    9311 ?        00:00:00 php-fpm7.0
   9312    9312 ?        00:06:22 php-fpm7.0
$ ps -C php-fpm7.0 -T --no-headers | wc -l
3
cat digunakan untuk menampilkan gabungan dari isi file dan teks.
grep <pattern> digunakan untuk menampilkan baris yang cocok dengan pattern. Opsi -vE <pattern> pada grep digunakan untuk mengecualikan pattern agar tidak ditampilkan.
$ echo "; sample 1" > /home/johndoe/sample.txt
$ echo "sample 2" >> /home/johndoe/sample.txt
$ echo "sampel 3" >> /home/johndoe/sample.txt
$ cat /home/johndoe/sample.txt
; sample 1
sample 2
sampel 3
$ cat /home/johndoe/sample.txt | grep sample
; sample 1
sample 2
$ cat /home/johndoe/sample.txt | grep sample | grep -vE "; "
sample 2
Bagaimana jika ingin menampilkan proses dari user tertentu?
Gunakan grep <pattern> setelah ps dengan opsi -o. Opsi -eo pada ps digunakan untuk menampilkan kolom tertentu.
Perhatikan contoh di bawah ini
$ ps -C php-fpm7.0 -T -o user
USER
www-data
www-data
johndoe
johndoe
johndoe
$ ps -C php-fpm7.0 -T -o user --no-headers
www-data
www-data
johndoe
johndoe
johndoe
$ ps -C php-fpm7.0 -T -o user --no-headers | grep johndoe
johndoe
johndoe
johndoe
$ ps -C php-fpm7.0 -T -o user --no-headers | grep johndoe | wc -l
3
free <option> digunakan untuk menampilkan penggunaan memori di dalam sistem. Opsi -h digunakan agar mudah dibaca. Opsi -m digunakan agar ditampilkan dalam satuan mebibyte.
awk '{print $<column>}' digunakan untuk menampilkan data pada kolom tertentu. head -<row> digunakan untuk menampilkan beberapa baris teratas. tail -<row> digunakan untuk menampilkan beberapa baris terbawah.
$ free -hm
        total  used  free  shared  buff/cache  available
Mem:    31G    11G   477M  470M    19G         19G
Swap:   11G    0B    11G
$ free -hm | awk "{print $4}"
shared
470M
11G
$ free -hm | awk "{print $4}" | head -2
shared
470M
$ free -hm | awk "{print $4}" | head -2 | tail -1
470M
bmon digunakan untuk menampilkan informasi tentang jaringan (bandwidth monitor), membutuhkan waktu 1 detik. Gunakan ifconfig untuk mendapatkan informasi kartu jaringan yang tersedia.
$ ifconfig
eth0: flags=4163<UP,BROADCAST,RUNNING,MULTICAST> mtu 2000
      ...
$ bmon -p 'eth0' -b -o format:fmt='$(element:name) $(attr:rxrate:bytes) $(attr:txrate:bytes) $(attr:rxrate:packets) $(attr:txrate:packets) ' -o format:quitafter=2
eth0 0.00 0.00 0.00 0.00 eth0 73134.35 3379.69 69.99 41.00
$ bmon -p 'eth0' -b -o format:fmt='$(element:name) $(attr:rxrate:bytes) $(attr:txrate:bytes) $(attr:rxrate:packets) $(attr:txrate:packets) ' -o format:quitafter=2 | awk '{print $6" | v "$7/1024"/"$8/1024" ^ Kbps | v "$9"/"$10" ^ pps"}'
eth0 | v 489.42/46.4539 ^ Kbps | v 387.97/216.98 ^ pps
top -bn2 digunakan untuk menampilkan gambaran proses yang berjalan di sistem tidak dalam real time agar teks dapat diproses. Membutuhkan waktu 2 detik
printf %.f atau ${variable%.*} berfungsi untuk menghilangkan desimal.
for digunakan untuk looping
$ a=100.1
$ echo $a
100.1
$ echo $((${a%.*} / 4))
25
$ for i in {1..4}; do echo -n '='; done; echo ''
====
$ for i in 1 2 3 4 5; do echo -n '='; done; echo ''
=====
$ for i in $(seq 1 $((${a%.*} / 4))); do echo -n '='; done; echo ''
=========================
Monitoring HTML
Cari informasi path dari web utama di server.
<VirtualHost *:443>
  #ServerName example.com
  <Directory "/var/www/html">
      #... setting webutama
  </Directory>
  #...
</VirtualHost>
Buat folder monitoring dan file log. Ubah pemilik sesuai dengan user dan group dari sub-domain yang digunakan.
mkdir /var/www/html/monitoring
echo "" > /var/www/html/monitoring/log.html
chown <userweb>:<groupweb> -R /var/www/html/monitoring/
chmod 555 /var/www/html/monitoring/
chmod a+rx,u+w,og-w /var/www/html/monitoring/log.html
Buat berkas monitoring per 10 detik sebanyak 6 kali sebagai root, nano /root/monitoring.sh
#!/bin/bash
#file /root/monitoring.sh
for run in {1..6}; do
  sh -c "echo '<meta http-equiv="refresh" content="10">'; echo '<pre>'; date; "<command>"echo '</pre>';" > /root/tmplog.html && cat /root/tmplog.html > /var/webservice/service/monitoring/log.html;
  #1 detik untuk bmon, 2 detik untuk top
  sleep 6;
done
Buat cronjob setiap 1 menit
*/1 * * * * /bin/bash /root/monitoring.shTune Up Performa
Move On MPM Prefork ke MPM Event, Sebuah Catatan
Demikian, semoga bermanfaat. [bst]